Most beginners set up Google Search Console, get the verification email, and then open the dashboard and freeze. There are reports for performance, coverage, enhancements, sitemaps, and more, none of them come with an obvious “start here” button. The tool looks like it was built for SEO engineers, not someone running a blog or a small business site on their own.
If you’ve ever wondered, “What does Google Search Console tell me about my website?”, this guide answers that question section by section. GSC is actually one of the most straightforward tools Google offers. Every report answers a specific question about how Google sees your site, and once you know which question each report answers, the whole thing clicks into place. This guide walks through each of the six core areas: Performance, Coverage, URL Inspection, Sitemaps, Core Web Vitals, and Manual/Security alerts. By the end, you’ll know what each report means and what to do when something looks off.
What Does Google Search Console Tell Me About My Website: Performance
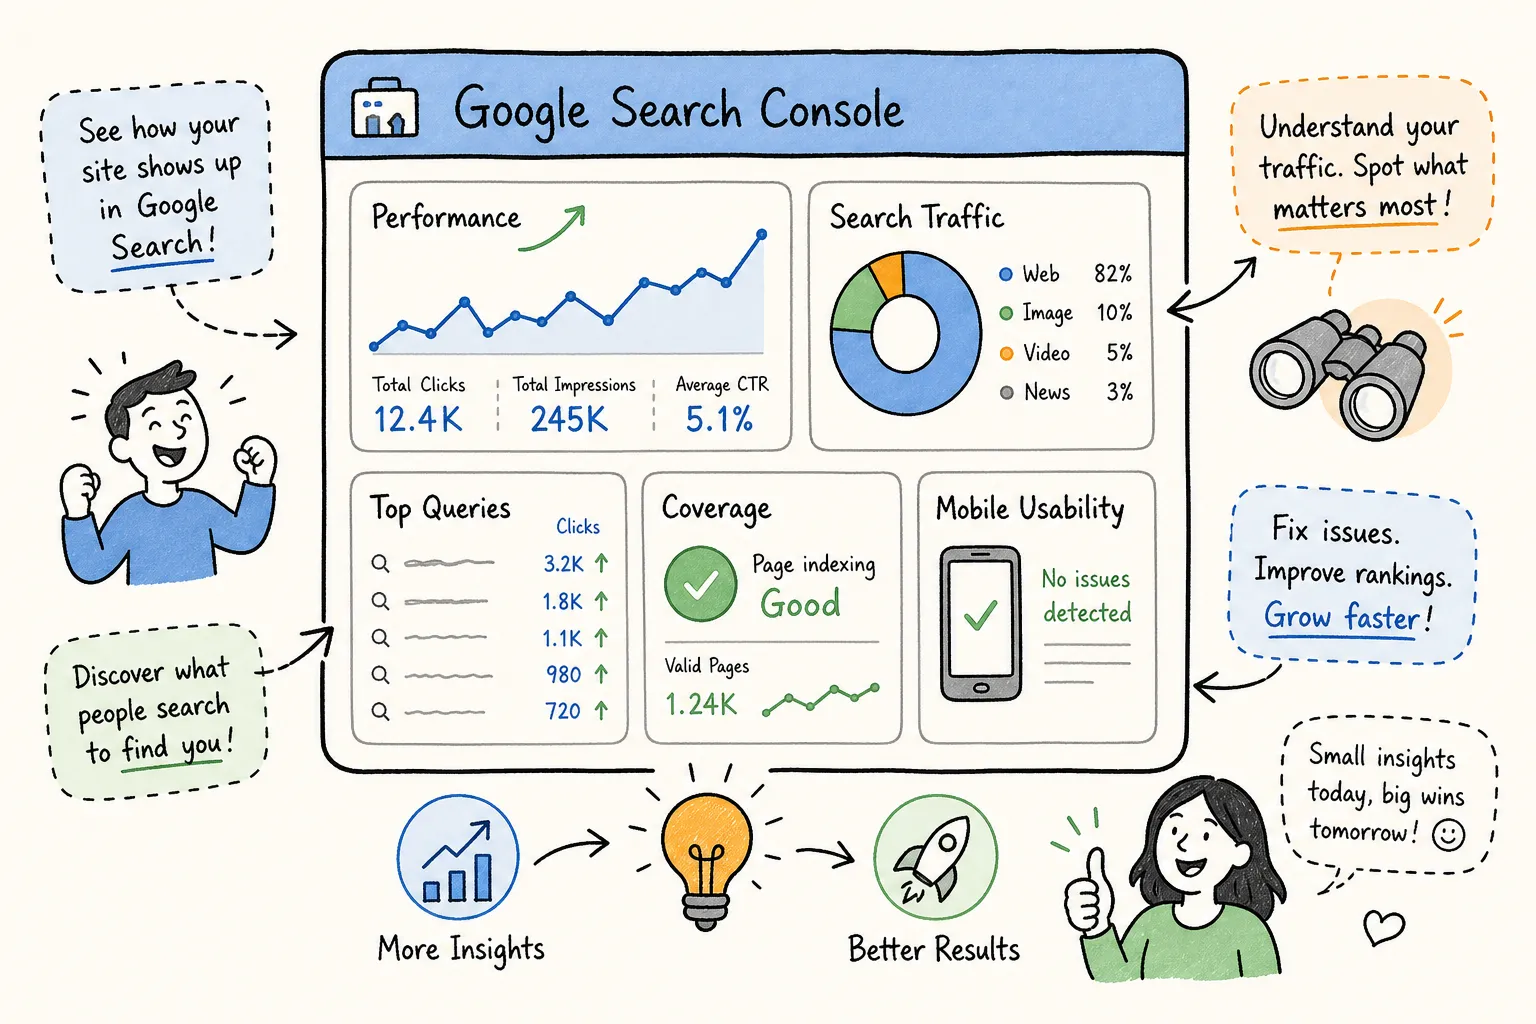
The Performance report is where most beginners should spend the most time. Think of it as GSC’s answer to the question: how is my site actually doing in Google Search? It shows data broken down by query, page, country, device, and date range. The report is built around four core metrics that are easier to understand than they first appear.
What clicks, impressions, CTR, and average position actually mean
Clicks are the number of times someone visited your site directly from a Google Search result. Impressions are how many times your page showed up in results, whether the user scrolled to it or not. CTR (click-through rate) is the percentage of those impressions that turned into actual clicks. Average position is where your result tends to land across all the times it appeared for a given query, averaged across all searches.
That last one trips people up. Average position isn’t a fixed rank. A page showing at position 2 half the time and position 12 the other half would average out to position 7, which doesn’t reflect either scenario accurately. Always interpret average position alongside impression volume to get the full picture.
Search Console performance report: find striking-distance queries
Open the Queries tab and sort by impressions. Then filter for pages sitting at average positions 4 through 15. This is the “striking distance” zone, Google already considers your page relevant enough to show, but it hasn’t broken onto page one consistently. These pages are your fastest wins because the authority signal is already there.
Pay attention to queries with high impressions but low CTR. According to FirstPageSage’s 2026 CTR benchmark data, a page ranking at position 1 earns roughly 39.8% of clicks on average, while position 5 drops to about 5.1%. If your page is sitting at position 4 or 5 and your CTR is well below those benchmarks, the title tag or meta description likely isn’t matching what searchers actually want. Rewriting the snippet is often all it takes to recover those clicks.
Turning Performance data into content action
GSC tells you which keywords you’re already showing up for, but it doesn’t help you evaluate search volume, keyword difficulty, or related terms at scale. That’s where pairing it with a dedicated keyword tool makes a real difference. Tools like KWFinder make it straightforward to take your striking-distance queries from GSC and research whether there’s a realistic path to page one, without the price tag of enterprise tools. How to Use Google Search Console for SEO, AISEO Round Table has an in-depth look at using GSC data with keyword research for exactly this use case.
What Google Search Console Tells You About Indexing
The Coverage report (now labeled “Indexing” in newer GSC versions) is Google telling you which of your pages it has successfully indexed and which ones ran into trouble. For a beginner managing their own site, this is the health check for your entire discoverability footprint. Many site owners ignore this report until a page mysteriously drops out of rankings, by then, the problem has often been sitting there for weeks.
For hands-on instructions and common fixes, see our Technical SEO Guides, Fixes & Website Optimization.
The four status types in plain English
Valid pages are in Google’s index and eligible to appear in search results. No action needed; just keep monitoring. Excluded pages were intentionally or unintentionally left out of the index. Some exclusions are fine, like staging pages or duplicate archive URLs, but others point to indexing problems worth investigating.
Valid with warnings means the page got indexed, but something looks off to Google. This often involves canonicalization signals that seem conflicting. It’s worth reviewing even if the page is showing up in search. Errors are the most urgent: Google tried to index the page and couldn’t. Every error deserves a look.
Common errors and what to do about each
A 404 or soft 404 means the page doesn’t exist or its content looks too thin or empty for Google to treat it as a real page. Fix it by restoring the content, redirecting to a relevant page, or removing it from your sitemap entirely. A “blocked by robots.txt” error means Googlebot can’t access the page at all, usually because a disallow rule is too broad. Check your robots.txt file and narrow the rule if the page should be crawlable.
A “noindex directive” error is actually you (or a plugin) telling Google not to index the page. This is sometimes intentional, but if the page should rank, check your SEO plugin settings or your page-level meta robots tag. Server errors (5xx) mean your site couldn’t respond to Google’s crawl, which usually points to a hosting or configuration issue that needs your host’s attention. One more common status worth noting: “Excluded: Duplicate without user-selected canonical” appears frequently on blogs and e-commerce sites with archive pages or filtered URLs. Adding a canonical tag pointing to the preferred version resolves it cleanly.
The URL Inspection tool: checking a single page on demand
When the Coverage report flags a specific URL, the URL Inspection tool is where you go next. It pulls data directly from Google’s index about one page at a time and gives you a much more detailed picture of what’s happening with that specific URL.
What the tool actually shows you
The tool returns whether the URL is in Google’s index, when Google last crawled it, whether Googlebot was blocked during the crawl, how Google canonicalized the URL, and whether any enhancements like structured data or AMP were detected. There’s an important distinction between the “indexed version” and the “live test.” The indexed version is what Google has stored. The live test shows how the page looks right now, useful when you’ve made a recent fix that hasn’t been picked up yet.
How to request indexing after fixing a problem
The process is straightforward: fix the issue first, then run the live test inside URL Inspection to confirm the page is now crawlable and indexable. Once the live test comes back clean, click “Request Indexing.” Set realistic expectations here. This queues your page for Google’s crawlers; it doesn’t trigger an instant update. For established sites, you’ll typically see results within a few days. This tool is especially useful after updating or republishing a post and wanting Google to pick up the new version faster.
Sitemap submission in GSC: making sure Google discovers your content
A sitemap is a file that lists all the URLs on your site that you want Google to index. Submitting it through GSC doesn’t guarantee every URL gets indexed, but it removes guesswork about where your content lives. This matters most for new sites, pages with few internal links, and any content you’ve published recently.
How to submit a sitemap and read its status
Go to the Sitemaps section in the left navigation, paste your sitemap URL (usually yourdomain.com/sitemap.xml, or whatever URL your SEO plugin like Yoast or Rank Math generates), and click Submit. A successful submission shows a “Success” status along with the number of URLs submitted and the number Google has discovered from that file. A big gap between submitted URLs and indexed URLs is a signal worth investigating in the Coverage report.
What to do when your sitemap shows an error
The two most common errors beginners hit are “Couldn’t fetch” and “Sitemap could not be read.” “Couldn’t fetch” usually means Google can’t access the file, often caused by the wrong URL being submitted, login protection on the page, or a server issue. “Sitemap could not be read” means the file has a formatting problem, typically caused by special characters in URLs or a plugin generating malformed XML. In either case, running the URL Inspection tool on the sitemap URL itself confirms whether Google can actually fetch the file, which is the fastest way to narrow down the cause. Google allows up to 50,000 URLs in a single sitemap file; if your site exceeds that, you’ll need to split into multiple sitemaps and use a sitemap index file.
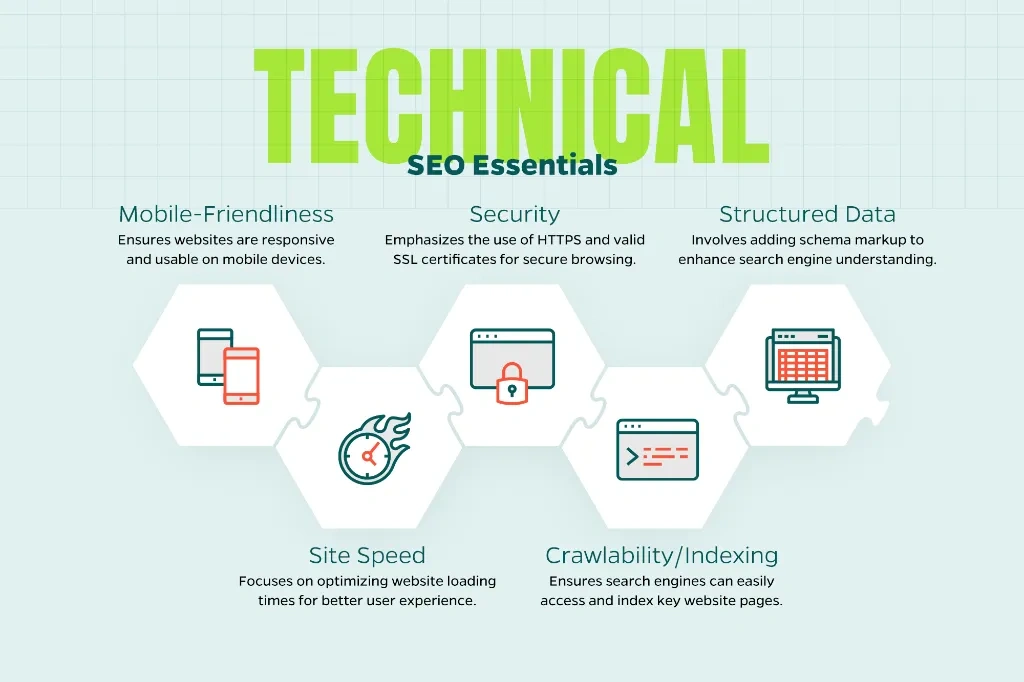
Core Web Vitals and enhancement reports: page experience and rich results
This group of reports goes beyond whether Google can find your pages. It tells you whether your pages deliver a good experience and whether they qualify for enhanced display in search results. Core Web Vitals became a confirmed Google ranking signal in 2021, which means poor scores can directly hold back pages that are otherwise well-optimized.
What Core Web Vitals tell you about your pages
The three metrics are LCP, INP, and CLS. LCP measures how fast the main content loads (Good is 2.5 seconds or under). INP measures how quickly the page responds to user interaction (Good is 200 milliseconds or under). CLS measures whether content shifts around unexpectedly as the page loads (Good is 0.1 or under). GSC groups URLs by similar performance patterns, so one “Poor” group can represent dozens of pages sharing the same root problem, like unoptimized images or render-blocking scripts. Fixing the root cause resolves the whole group at once.
Structured data and rich result eligibility
If you’ve added schema markup to your pages for recipes, FAQs, reviews, or how-to content, GSC’s enhancement reports show whether that markup is valid and whether the pages qualify for rich results. Valid items are eligible for enhanced display in Google Search. Errors mean the markup has a problem that disqualifies the page from rich results entirely. Fixing structured data errors is one of the higher-ROI tasks in GSC. Google’s Search Central documentation and case study data indicate that pages shown as rich results earn significantly higher CTR, one reported example showed an 82% CTR lift for pages with valid structured data compared to standard blue-link listings.
manual actions and security issues: the alerts that need immediate attention
These two report types are what most site owners hope they never see. Both represent serious problems that directly suppress your visibility in Google Search, and both require action before anything else takes priority.
What a manual action means for your site
A manual action is applied by a Google reviewer when your site violates Google’s spam policies. This is a human decision, not an algorithm update. Common triggers include thin or low-quality content, unnatural backlink patterns, cloaking, or structured data misuse. A manual action can remove individual pages or your entire site from search results until the issue is corrected and a reconsideration request is submitted and approved by Google. The review process typically takes several days to a few weeks, though link-related requests can take longer. If this report shows any active actions, stop what you’re doing and fix it first. For details on how Google handles manual actions, see Google’s guidance on the topic.
How Google flags security threats
The Security Issues report is Google’s warning system for hacked content, malware, deceptive pages, or harmful downloads on your site. When Google detects these, it may show a warning to users directly in search results or suppress your pages altogether. The response process follows a clear sequence: identify the affected URLs in the report, clean the infection or remove the harmful content, fix the underlying vulnerability that allowed the breach, and then request a review directly within GSC. Don’t skip the vulnerability fix. Submitting a review without addressing the root cause leads to another infection and another suppression.
Putting it all together
Now you know what Google Search Console tells you about your website, and more importantly, how to act on it. The Performance report shows you what’s working and where to push harder. The Coverage and URL Inspection tools show you what’s broken and how to fix it. Sitemap submission in GSC helps Google discover everything you’ve published. Core Web Vitals and enhancement reports tell you whether your pages qualify for better visibility in search. And manual actions and security issues tell you when something needs to be resolved right now, before anything else.
Start with the Performance and Coverage reports. Those two deliver the fastest, clearest wins for most sites: you’ll identify ranking opportunities you can act on today and find pages that aren’t showing up in search for reasons Google is happy to tell you. From there, work through URL Inspection, sitemaps, and enhancements as your site grows.
GSC tells you the “what.” The next step is building the habits and using the right tools to act on it consistently. The guides and reviews at AISEO Round Table are built to help bloggers, freelancers, and small business owners do exactly that, no agency required, no web development background needed. If you’re tracking broader search trends for stakeholders, check Google’s AI Search Experiments: What Your C-Suite Needs to Know, AISEO Round Table for a concise briefing.