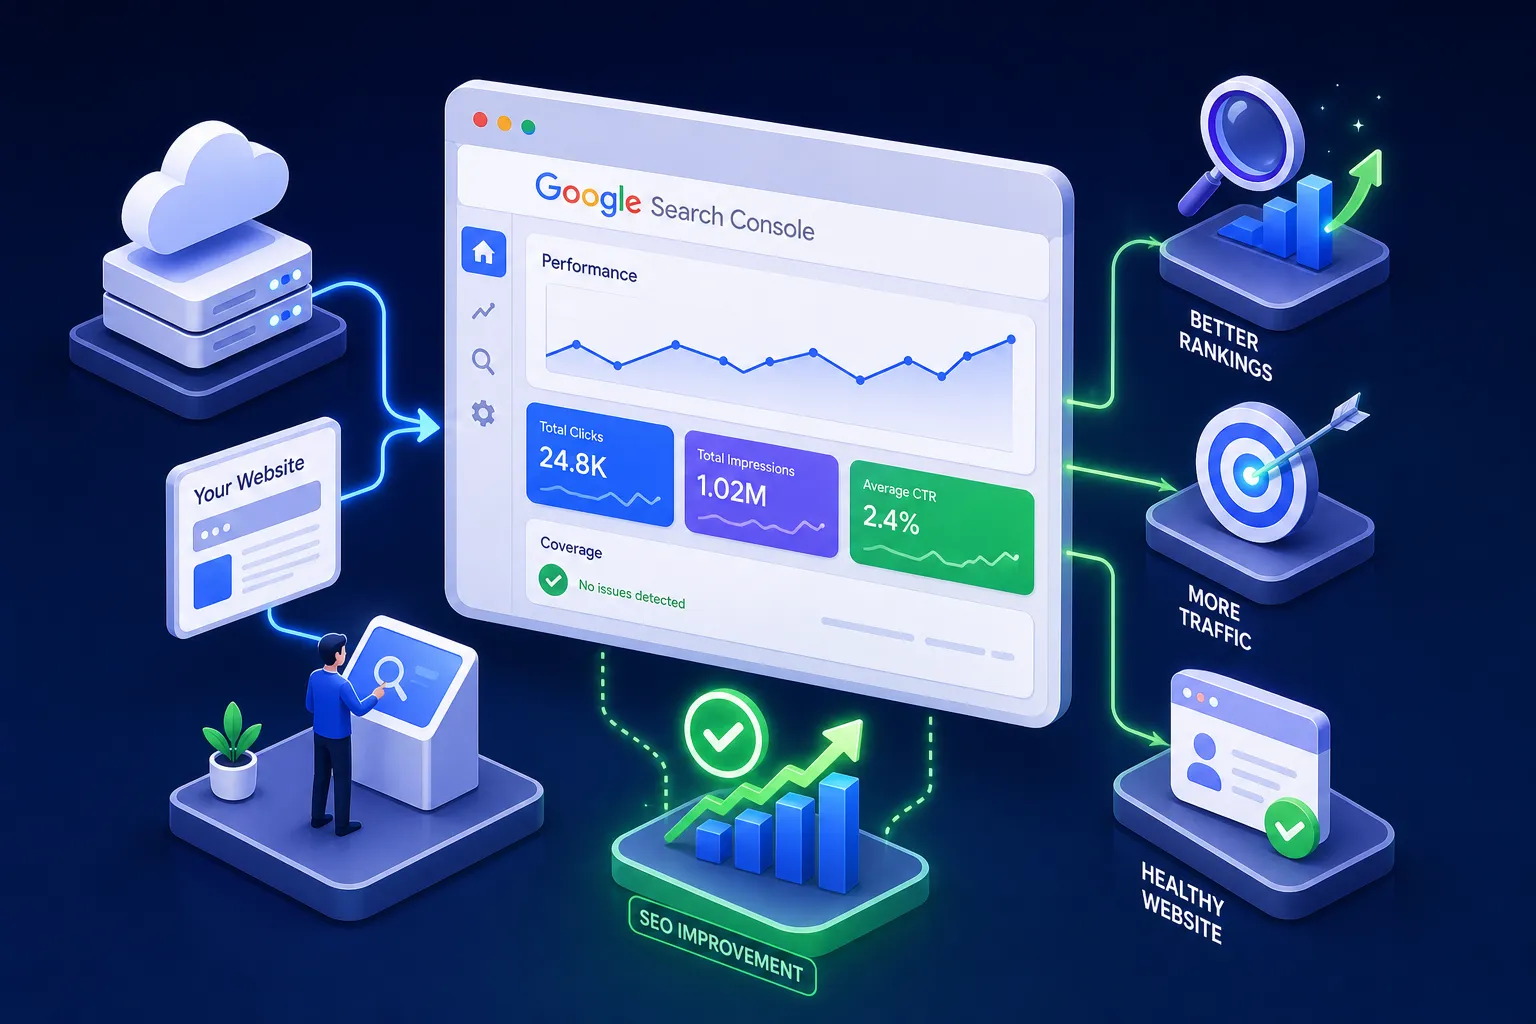
If you’ve ever wondered, “How do I use Google Search Console to improve my SEO?”, you’re asking exactly the right question. You’ve published a dozen posts, maybe more, but you have no idea whether Google is actually crawling them, indexing them, or showing them to anyone. That frustration is one of the most common things we hear at AISEO Round Table, and it’s exactly why Google Search Console is the first tool we walk every new blogger through. It’s not a vanity dashboard. It’s a direct diagnostic line between your site and Google’s index, and it’s completely free.
Many users report logging in once, seeing some green checkmarks, and never returning. GSC earns its value when you check it regularly and act on what it shows you. By the end of this Google Search Console tutorial, you’ll know how to verify your property, read Performance data, diagnose indexing errors, use URL Inspection properly, monitor Core Web Vitals, and build a repeatable weekly routine around the whole thing.
How do I use Google Search Console to improve my SEO? Start with setup.
Setup typically takes anywhere from a few minutes to half an hour depending on your familiarity with DNS and hosting access, and it only happens once per property, so it’s worth doing right. When you add a new property in Search Console, Google asks you to choose between a Domain property and a URL-prefix property. The Domain property covers every subdomain and protocol variation of your site (http, https, www, non-www) and is verified through a DNS TXT record added at your domain registrar. The URL-prefix property covers only one specific URL and can be verified via an HTML meta tag or file upload.
The two options involve real tradeoffs. The Domain property consolidates all your traffic data across subdomains and protocols in one place, but it requires DNS verification. The URL-prefix property is often easier to verify, just drop an HTML meta tag into your site’s , but it won’t capture traffic from subdomains or alternate protocols. For a single WordPress blog or small business site where you don’t need cross-subdomain coverage, either approach works. Choose based on whether you’re comfortable editing your DNS settings. Google walks you through each step inside the verification flow, and you can confirm success within a few minutes of adding the tag or DNS record.
Once your property is verified, head to the Sitemaps panel in the left sidebar. Enter your sitemap URL (usually yourdomain.com/sitemap.xml for WordPress sites using Yoast or Rank Math) and click Submit. A sitemap lists the URLs you want Google to discover and can help Google prioritize crawling, though submitting one doesn’t guarantee that every listed URL will be indexed. It’s still far more reliable than waiting for Google to find pages through link discovery alone.
Reading the Performance report to find quick ranking wins
The Performance report is the most valuable section in Search Console, and it’s the one most beginners glance at once and move on from. Open it and make sure all four metrics are toggled on: clicks, impressions, CTR, and average position. These four numbers tell a complete story when read together. Clicks are the actual visits from search. Impressions count how many times your pages appeared in results. CTR is clicks divided by impressions. Average position is the mean ranking of your pages across the queries they appear for.
Finding low-CTR pages
Here’s a practical example. If a page earns 2,000 impressions per month but only 20 clicks, that’s a 1% CTR. The page is showing up, but searchers aren’t choosing it. That typically points to one of three causes: a weak title tag, a meta description that doesn’t match what the searcher actually wants, or a misaligned intent between the content and the query. High impressions with low CTR is often a quick win in SEO because the ranking work is already done, you just need to make the result more appealing in the search results. It’s also worth considering how results are presented in newer result formats, for guidance on adapting content for generative result formats, see our How to Optimize for Google’s Search Generative Experience, AISEO Round Table.
Switch to the Pages tab to see which specific URLs are burning impressions without earning clicks. Sort by impressions descending and scan down the list for outliers where CTR falls well below your site’s average. Keep in mind that CTR benchmarks vary by query type and intent, so use your site’s own average as a reference point rather than applying a universal cutoff.
Using date comparisons
Use the date comparison feature, setting your current 28-day window against the previous 28 days, to catch content that’s slowly losing ground before a full ranking drop hits. Catching a 3-position slip early is far easier to fix than recovering from a page-two demotion.
Diagnosing and fixing index coverage errors
The Page Indexing report (formerly Index Coverage) shows you a clear split: pages Google has indexed, pages it’s actively excluded, and pages flagged with errors. This is where Search Console troubleshooting really begins. Click into any error reason and Google shows you example URLs so you can inspect exactly what’s going on. Beginners most commonly run into several categories of errors, and each has a specific fix.
Excluded by noindex means a tag on the page is intentionally telling Google to stay out. If that’s a mistake, common on pages accidentally tagged during development, remove the noindex directive and re-test. Blocked by robots.txt means your robots file is preventing crawling entirely. If the page should be public, update the robots.txt rule to allow access. “Crawled, currently not indexed” is the tricky one: Google visited the page but decided the content wasn’t worth including. That usually means thin content, duplication, or a page with no clear purpose. Improving the depth and usefulness of the content is the fix. For 404s, either restore the page or add a proper redirect to the most relevant live URL.
The step most beginners skip is clicking the Validate Fix button after resolving an issue. Without that click, Google doesn’t know you’ve addressed the problem and won’t prioritize recrawling those URLs. Work through it methodically: click the error reason, inspect the example URLs, apply the fix, and test the live URL using URL Inspection before hitting Validate Fix. That last step is what closes the loop, skipping it leaves you guessing why nothing changed.
Using URL Inspection after publishing or updating content
URL Inspection is a single-URL diagnostic tool, not a batch scanner for your whole site. Its job is to show you what Google currently knows about one specific page: the indexed status, the last crawl date, and whether any canonical mismatch or blocking issue is present. Use it after publishing new content, after fixing a coverage error, or after making a significant update to an existing page.
The workflow has three steps. First, paste the full URL into the inspection bar and review the current indexed status. Second, click Test Live URL to confirm Google can access the updated version of the page right now. If the live test comes back clean with no blocking issues, click Request Indexing once. That’s the entire process. Don’t click Request Indexing multiple times, repeated submissions don’t speed anything up, and the feature is designed for meaningful updates, not routine pings. For a practical look at URL Inspection use cases and how SEOs apply the tool day-to-day, see this overview of the URL Inspection tool use cases.
Set realistic expectations for timing. After a successful request, most pages move through the crawl queue within 2 to 10 days. Well-established sites with strong authority often see faster results, while newer sites may wait closer to two weeks. The request puts you in the queue; it doesn’t guarantee a specific crawl time. For technical guidance on asking Google to recrawl updated pages, consult the official documentation on how to ask Google to recrawl.
Monitoring Core Web Vitals and Mobile Usability
Core Web Vitals measure real user experience across three dimensions. LCP (Largest Contentful Paint) measures loading performance: good is under 2.5 seconds, poor is over 4 seconds. INP (Interaction to Next Paint) measures responsiveness: good is under 200 milliseconds. CLS (Cumulative Layout Shift) measures visual stability: good is a score of 0.1 or below. These thresholds aren’t arbitrary, they’re drawn from real-user Chrome data collected from actual visitors to your site, which makes them more meaningful than any lab test.
In Search Console’s Core Web Vitals report, pages are grouped into Poor, Needs Improvement, and Good. A URL group’s status is always determined by its worst-performing metric, so a page that loads fast but has a high CLS score still gets classified as Poor overall. If your site’s analytics show the majority of traffic coming from mobile devices, or if you’re subject to mobile-first indexing, start with the Poor group on mobile, since mobile Core Web Vitals tend to regress more frequently and may have a greater impact on rankings for mobile-heavy sites. Click into a flagged group to see which URLs are affected and what metric is causing the problem.
The Mobile Usability report is worth checking separately, especially after template changes or new content formats. Issues like clickable elements that are too close together or text that’s too small to read on a phone surface here before they compound into ranking problems. Treat this report as an early warning system: catch layout issues when they’re easy to fix rather than after they’ve affected performance data.
Turning your GSC data into a concrete ranking action plan
GSC data is diagnostic, it shows you symptoms and points toward causes, but it doesn’t always hand you the full prescription. A common mistake bloggers make is treating each report in isolation rather than following a consistent priority order. Here’s the sequence that makes the most impact:
- Fix indexing errors first. Pages Google can’t index can’t rank. Coverage errors block everything downstream.
- Target high-impression, low-CTR pages next. Rewrite title tags and meta descriptions to better match the search intent behind the queries driving those impressions.
- Address Core Web Vitals issues. Start with any page groups flagged as Poor and work down to Needs Improvement.
- Use URL Inspection for new and updated content. Request indexing once after any significant publish or update.
- Monitor date comparisons weekly. Catch ranking slips early using the 28-day vs. 28-day comparison in the Performance report.
One gap GSC doesn’t fill is keyword opportunity discovery. The Performance report shows which queries you already appear for, but it doesn’t reveal keyword difficulty, search volume trends, or related terms you’re missing entirely. That’s where pairing GSC with a dedicated keyword research tool completes the picture. At AISEO Round Table, we’ve found Mangools to be an affordable, practical option for bloggers and small site owners. You can take the queries GSC surfaces, check their difficulty in KWFinder, and expand into related long-tail terms you’re not yet targeting, see the KWFinder long-tail keyword research features for ideas. We cover that full workflow in our How to Use Google Search Console for SEO, AISEO Round Table.
For a weekly check-in, smaller sites can usually get through the essentials in 10 to 20 minutes; larger or more complex sites will need more time. Review the Performance report for any significant drops in clicks or impressions, check the Page Indexing report for new errors, and spot-check any pages you published or updated that week using URL Inspection. Consistency matters more than depth here, a regular weekly check catches problems early and compounds into real SEO progress over time. If you’re looking for a full operational checklist to run through during those audits, see our Step-by-Step SEO Audit Guide for Better Rankings, AISEO Round Table.
How to use Google Search Console to improve your SEO, and keep improving
Google Search Console is not a set-it-and-forget-it tool. It’s a weekly diagnostic that shows you where rankings are being lost and where quick wins are waiting. The capabilities you’ve just walked through, verifying your property and submitting your sitemap, reading the Performance report for CTR and ranking opportunities, diagnosing and fixing coverage errors, using URL Inspection after updates, and monitoring Core Web Vitals and Mobile Usability, give you everything you need to act on what Google is already telling you. For details on verification methods and troubleshooting verification errors, consult Google’s verification help on how to verify your property.
The best next move is simple. Open Search Console right now, click the Performance report, switch to the Pages tab, and sort by impressions. Find a page with high impressions and a CTR that falls noticeably below your site’s average, that’s your first action item. Improve the title tag to better match what searchers want, and check back in two weeks. That single habit, repeated consistently, is how you use Google Search Console to improve your SEO in a way that actually compounds.